Posts

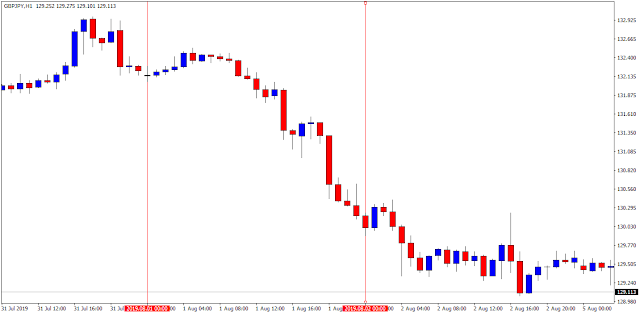
GBP JPY TJ, 1st setup

Image
Rabu - 22/8 Ternampak 2 Resistance zone / previous high di antara 129.375 dan 129. 325 dengan pagi ni antara jam 7 dan 8 am candle menjadikan LH terbaru di 129.3 dan adanya reversal point, maka entry SELL dibuat di h1 jam 9am. Target adalah di 129.00, dan seandai price break ke bawah sebelum 8 jam pertama, maka akan berlaku terjunan. SL adalah di 129.35 / 129.4 dan intraday TP di 129.00 Kita akan lihat perkembangan seterusnya dalam tempoh 3 jam akan datang ni samada price akan reject di antara zon area 129.00 untuk create LOD  atau sebaliknya If LOD terbentuk, maka akan mencari peluang buy di kemudian waktu pula.

GBP JPY - Trading Journal 2019 - Testing Straegi Baru

Image
Lama dah x update. As of now, sedang mengkaji how to trade intraday bagi pair GBP JPY menggunakan kefahaman HLOTD (high low of the day) Hampir sama dengan kefahaman SHUNPO dulu but dulu menggunakan konsep kiraan in advance untuk penentuan but sekarang lebih kepada memastikan "confirmation" berdasarkan kepada SNR yang terbentuk dari tf kecil serta dengan confirmation trend. HLOD yang pertama akan terbentuk di awal pagi antara 2 h4 yang pertama (antara jam 5 pagi ke 1pm) manakala HLOD yang kedua adalah di h4 yang keempat (jam 5 ke 9pm) PIC 1 di atas menunjukkan TF H1 pada 1/8/2019 (dari vertical line yang ditanda). Kita akan mencari HLOD yang pertama, dan di dalam senario di atas adalah high . PIC 2 di atas menunjukkan 2 previous HIGH sebelum 1/8 di mana yang pertama adalah di area 132.950 dan yang kedua adalah di area 132.775. Maka kita akan mencari samada price akan retest previous High atau mencari High yang baru. Ini mestilah diselarikan dengan timing y

EUR USD Analysis - 26/11 - 30/11

Image
There are 2 possible direction moves, 1) 1.13130 2) 1.12160 If price were to reject at 1.13130, a possible inverted HNS move may occur with a bullish momentum. If price were to break 1.13130 and headed towards 1.12160, then a possible further break downwards. H4 indicates a previous Demand zone with the lowest at 1.13209. Price may create a daily low as of Monday first before making a high with the trend may shift as bullish daily. I will set up a buy limit at 1.13209 with a tight SL at 1.13144 first. And of course monitoring price movement for the 1st h4 with a targeting move towards 1.1325. If the price fail to touch or break below 1.1325 by the 1st 8 hours, then potential buy target towards the 1.1375 / 1.1400. Additional Notes Looking into it overall just made me realize that the price is playing within the normal zone (outside of HZ) between 1.1425 and 1.1325. As the rejection at 1.1425 indicates a clear rejection onto the UHZ , hence price make a move

EUR USD post mortem - 19/11 - 23/11

Image
Analysis on what transpire for EUR USD this week (19/11 - 23/11) Monday and Tuesday has created a Bearish Engulfing move which would indicate a potential retest between the body and the shadow zone. Basically the candle rejection on monday and tuesday is in line with a SBR zone at 1.1450 hence the rejection. Wednesday and Thursday indicate a pullback for retest move at the particular zone area before of the so called supply zone. As friday price mades the high first before jumping for the bearish momentum towards the low zone. H4 for the particular Supply zone indicate that there`s another supply within between 1.1425 and 1.1450. Hence it would mean - a strong possible reason for the price to retest the zone concerned. And also a meaning to place a Sell Limit order at that price of 1.1425 with a tight SL of 1.14375 which indicates as of 22/11 that the price would trigger as the high of then h4 of 22/11 was at 1.14331 (differences of 6.1 pips ) and 4.4 pips away